Renata Raidou, Meister Eduard Gröller, and Martin Eisemann
(IEEE Transactions on Visualization and Computer Graphics, 25(6), pp.2205-2216, 2019; doi)
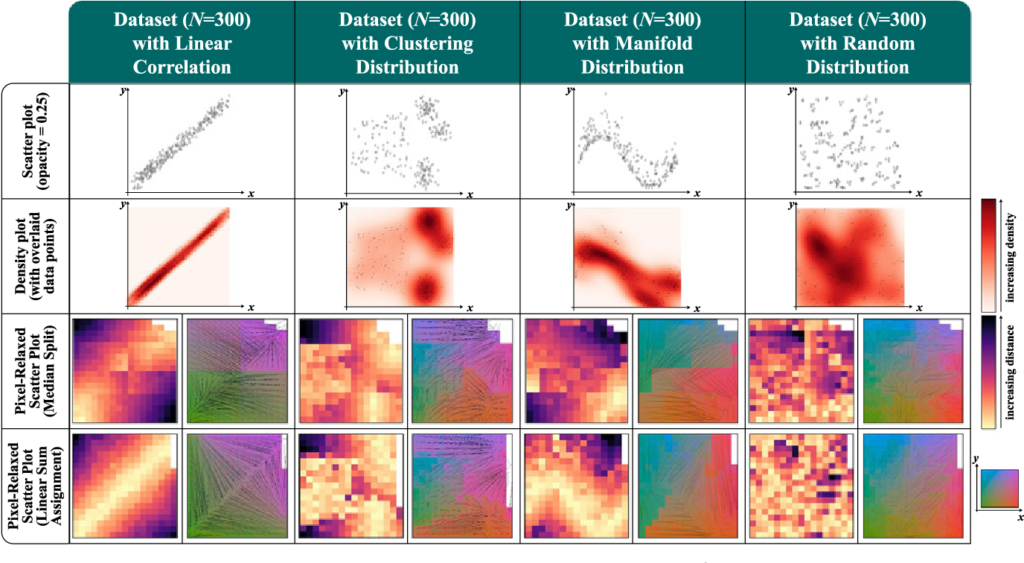
Scatter plots are the most commonly employed technique for the visualization of bivariate data. Despite their versatility and expressiveness in showing data aspects, such as clusters, correlations, and outliers, scatter plots face a main problem. For large and dense data, the representation suffers from clutter due to overplotting. This is often partially solved with the use of density plots. Yet, data overlap may occur in certain regions of a scatter or density plot, while other regions may be partially, or even completely empty. Adequate pixel-based techniques can be employed for effectively filling the plotting space, giving an additional notion of the numerosity of data motifs or clusters. We propose the Pixel-Relaxed Scatter Plots, a new and simple variant, to improve the display of dense scatter plots, using pixel-based, space-filling mappings. Our Pixel-Relaxed Scatter Plots make better use of the plotting canvas, while avoiding data overplotting, and optimizing space coverage and insight in the presence and size of data motifs. We have employed different methods to map scatter plot points to pixels and to visually present this mapping. We demonstrate our approach on several synthetic and realistic datasets, and we discuss the suitability of our technique for different tasks. Our conducted user evaluation shows that our Pixel-Relaxed Scatter Plots can be a useful enhancement to traditional scatter plots.
BibTeX
@article{raidou2019relaxing,
  title={Relaxing Dense Scatter Plots with Pixel-Based Mappings},
  author={Raidou, Renata G and Gr{\"o}ller, M Eduard and Eisemann, Martin},
  journal={IEEE Transactions on Visualization and Computer Graphics},
  volume={25},
  number={6},
  pages={2205--2216},
  year={2019},
  publisher={IEEE}
}